How can a transparent modelling workflow investigate different energy resources for hydrogen-related applications? In my Master’s project, I developed simplified representations of photovoltaic energy, parabolic-trough concentrated solar power, geothermal energy, and industrial waste-heat recovery. The work combines 3D system modelling, thermal and CFD simulations, scenario automation, and numerical post-processing.
Scope
The project examines component behaviour and the evidence needed to connect each stage of the conversion chain. It is a prototype-scale numerical study. The archived results are presented with their assumptions and limitations; they do not establish a validated industrial plant or a ranking of the four technologies.
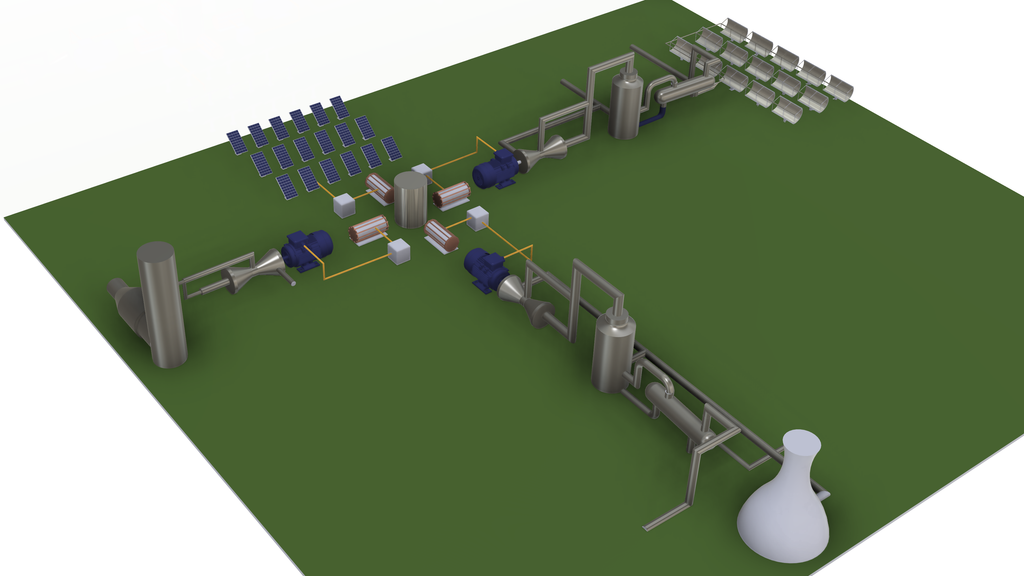
components. This is a system-layout illustration, not a constructed installation
Problem and context
The engineering problem
The four pathways start from different physical resources. Photovoltaics convert incident radiation
into electricity, while CSP, geothermal energy, and waste-heat recovery first involve heat transfer
and additional conversion stages. Expressing their outputs in the same hydrogen unit does not
automatically make their capacities, resource inputs, or system boundaries comparable.
Study boundary
I used simplified component models and representative operating scenarios to make the investigation manageable. The archive contains nine PV scenarios, nine CSP scenarios, six geothermal scenarios and six waste-heat-recovery scenarios. These are operating points rather than an annual production model. Complete thermal-to-electric cycle closure and a common basis for technology ranking remain outside the demonstrated results.
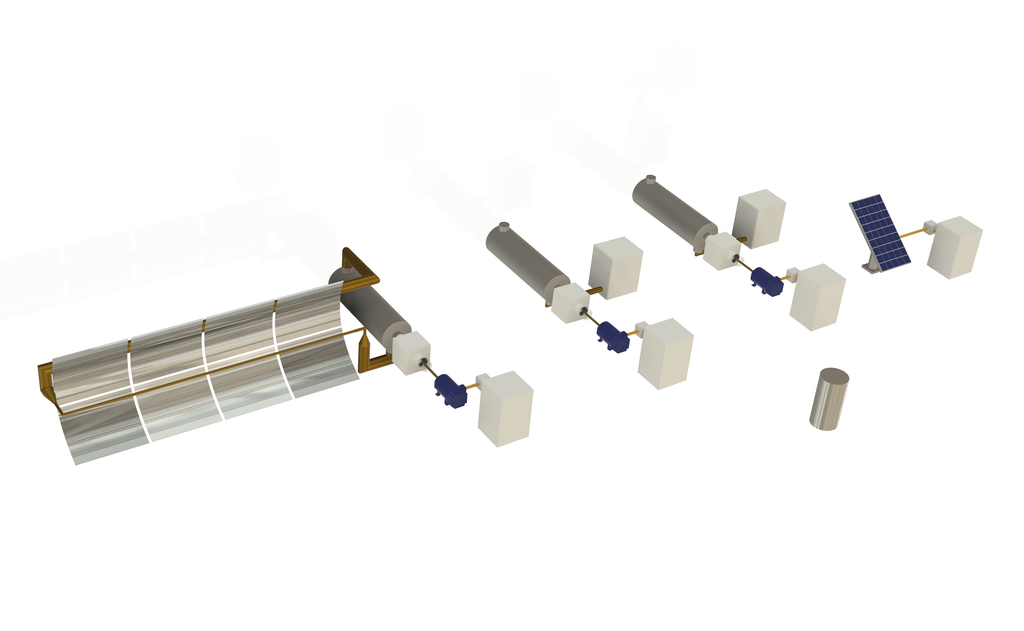
stages represent intended downstream calculations, not a demonstrated closed conversion chain.
Four pathways, different physics
| PV | CSP | Geothermal / WHR |
| Solid temperature fields and archived DC estimates. | Imposed receiver-flux cases and thermal-fluid stages. | Source-temperature and flow scenarios, heat exchangers and pressure-flow diagnostics. |
My role and method
Personal contribution
My contribution included software development, numerical investigation, data curation, formal analysis, and visualization. I prepared the scenario workflows, organized thermal and flow outputs, and drafted the technical interpretation. The associated research was developed with collaborators and supervisors; conceptualization and methodology were shared contributions.
Toolchain
I used ANSYS Workbench to organize the component models, ANSYS Steady-State Thermal for the PV solid-temperature model, and ANSYS Fluent for thermal-fluid stages. MATLAB supported scenario generation and launch automation, with MATLAB/Python and spreadsheets used for post-processing. The workflow follows resource-specific inputs through component calculations and then through explicitly documented downstream assumptions.
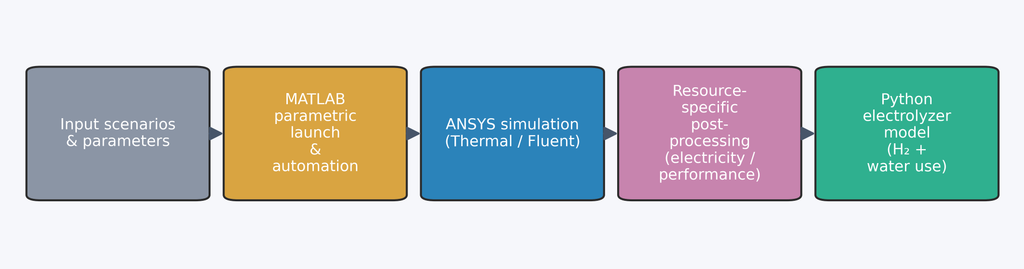
calculation handoffs; they do not demonstrate physical closure or validation of the downstream hydrogen
estimate.
Evidence review
I subsequently examined what the archived records could support. This involved distinguishing saved outputs from recalculated quantities, checking source-to-output links, and identifying gaps in numerical verification and component coupling. Complete replay of every original scenario has not been demonstrated.
Method summary
- Define each resource scenario and the component boundary.
- Generate thermal or flow results with the appropriate solver.
- Preserve exported quantities, units, and scenario identifiers.
- Separate reproducible calculations from additional physical assumptions.
- Limit the engineering interpretation to the evidence available.
Evidence: PV and CSP
Photovoltaic branch
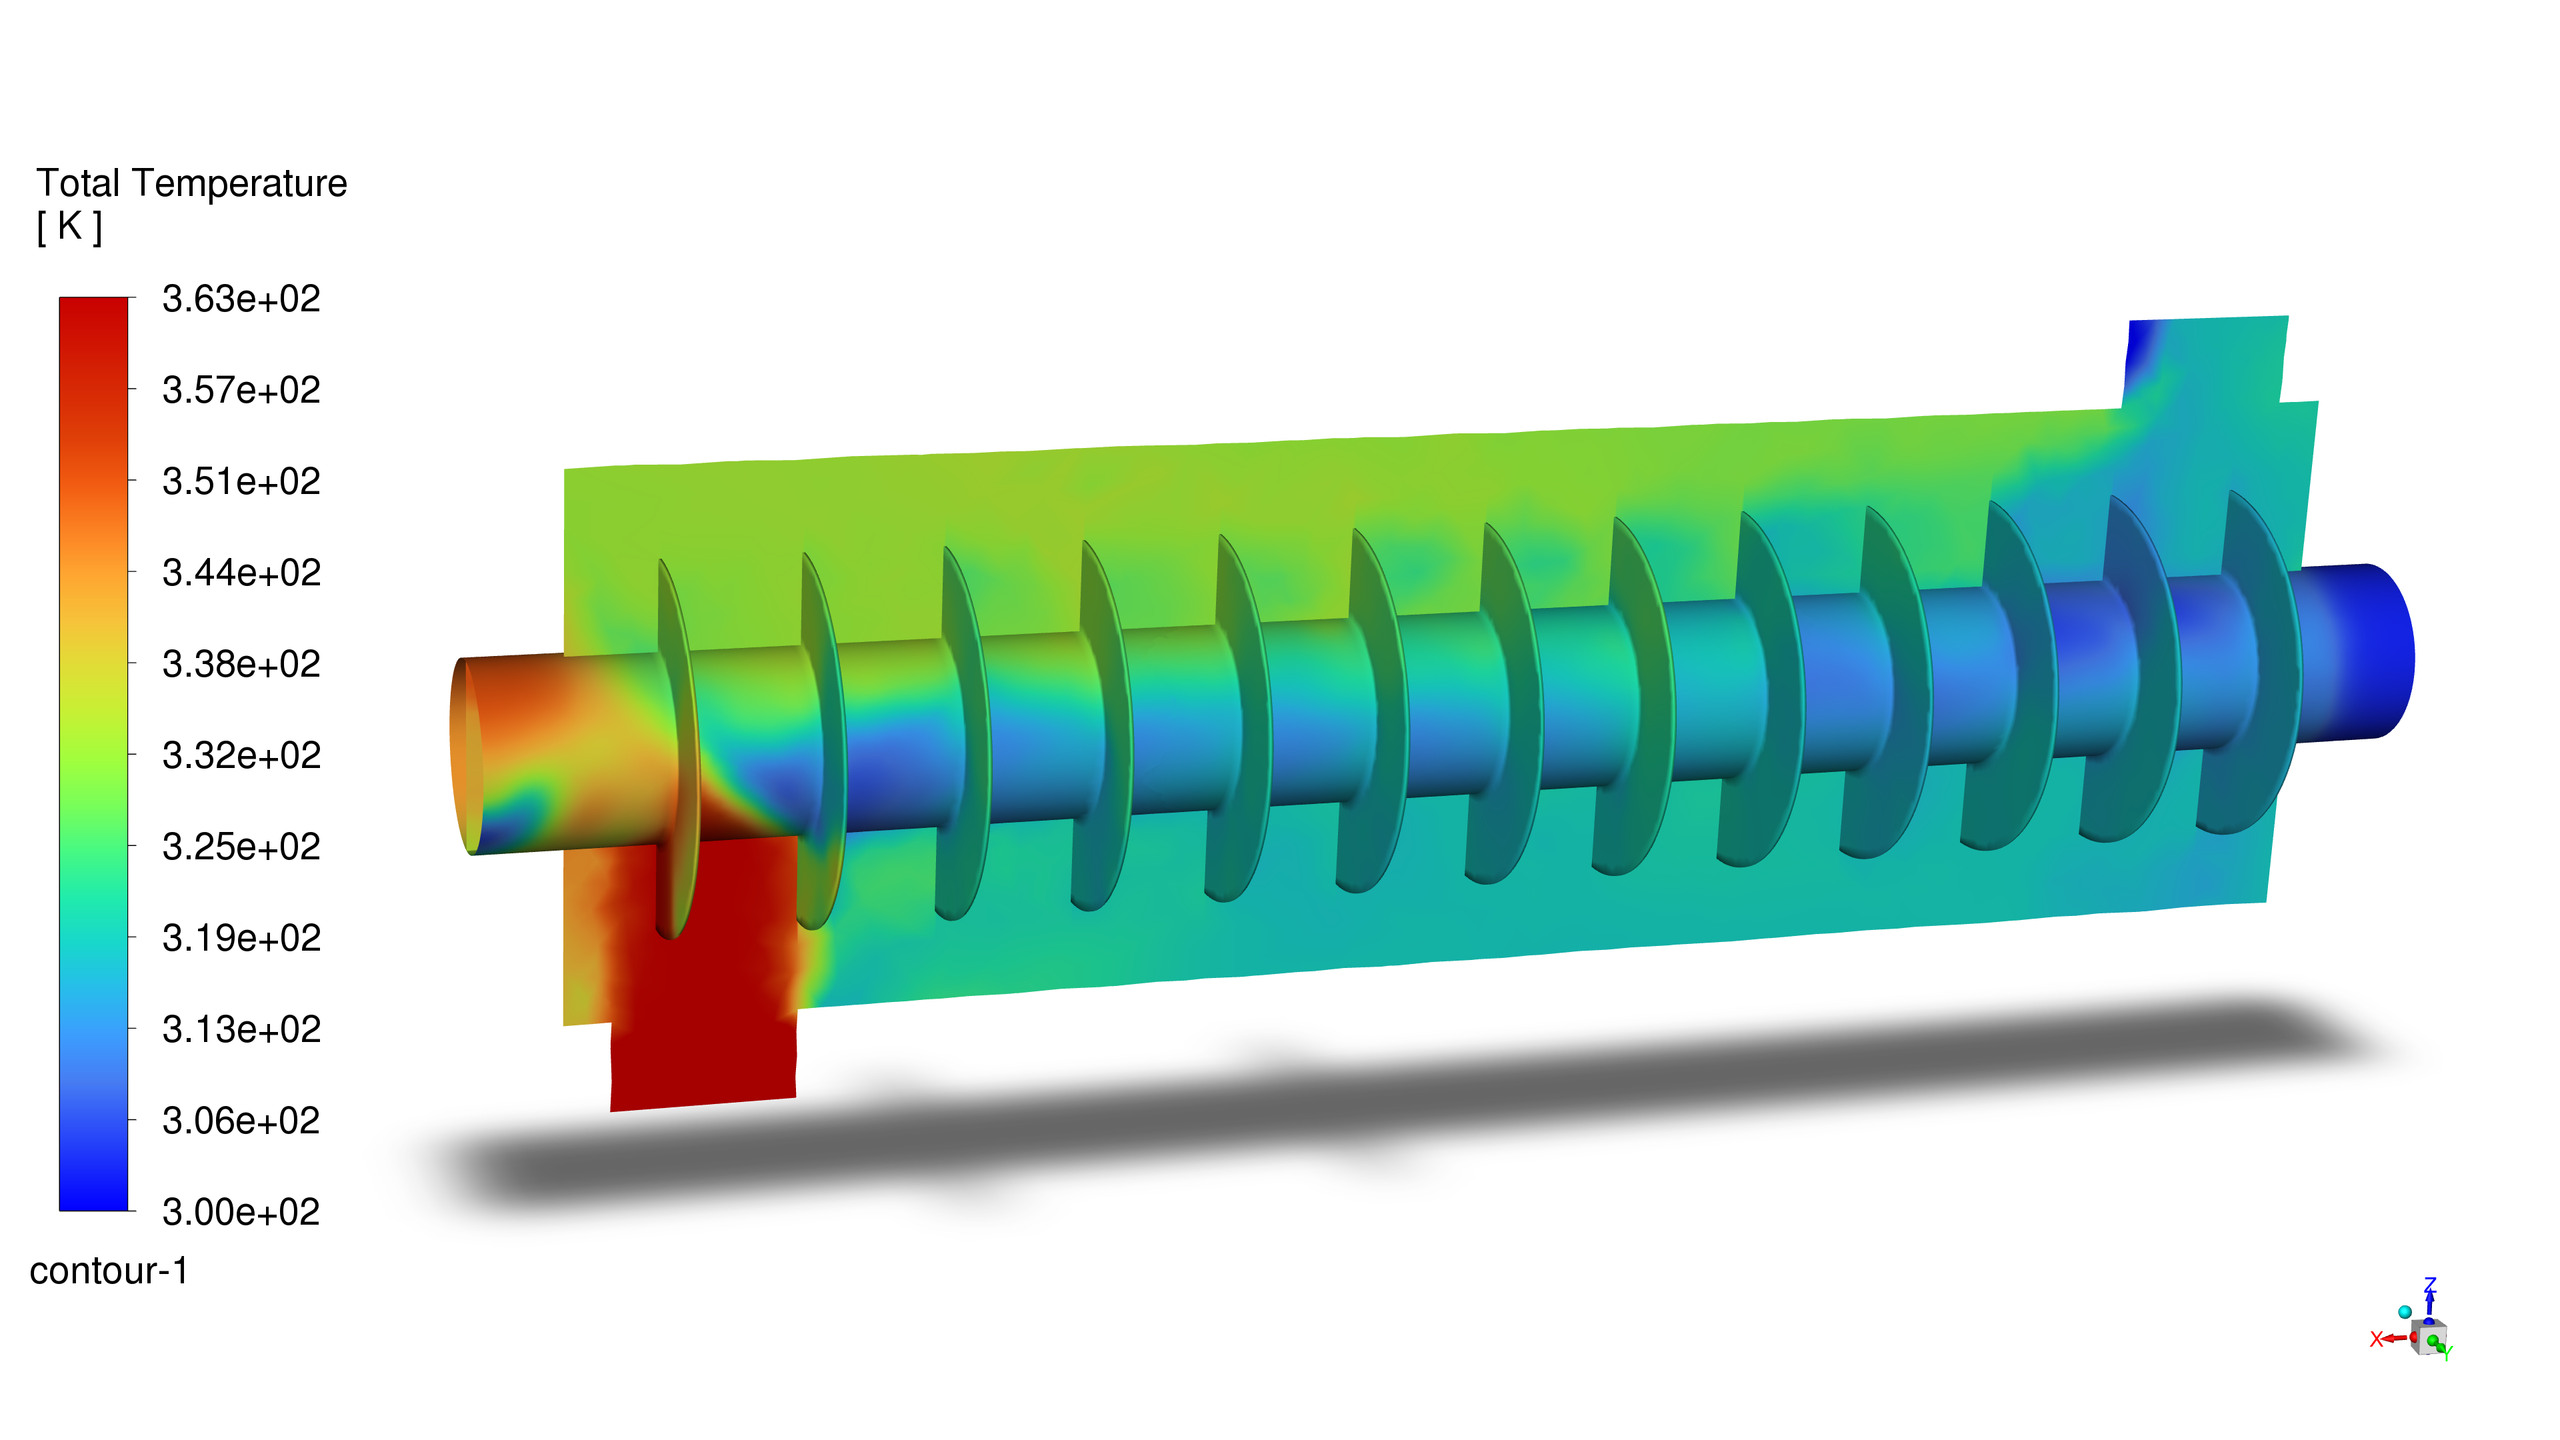
The archived PV DC estimates range from 33.31 to 65.44 W across the nine scenarios. They describe the saved study outputs; unresolved module-area and final electrical-model provenance prevent treating them as validated module-performance predictions. The temperature field below documents the spatial result for PV-S3.
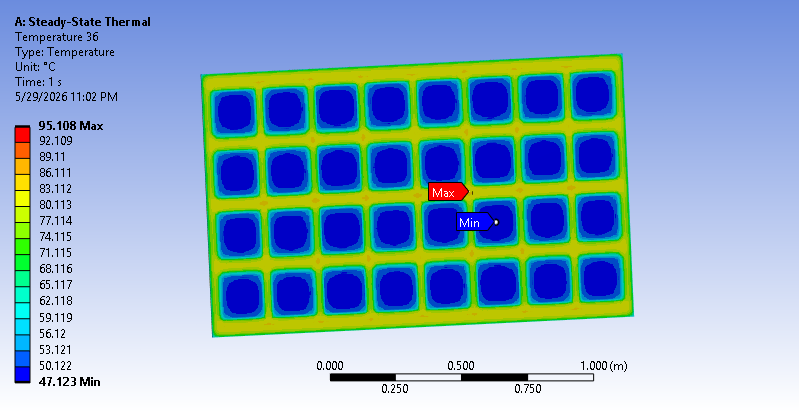
grid independence and electrical performance validation have not been established.
Concentrated solar power branch
The CSP archive reports heat-transfer exports of 2.333-6.421 kW. These are thermal quantities, not electrical output. Unresolved boundary and state mapping prevent a verified receiver energy balance. The CSP-S3 heat-exchanger field below provides a qualitative view of the archived temperature distribution.
simulation archive; not a validated heat-to-electricity result.
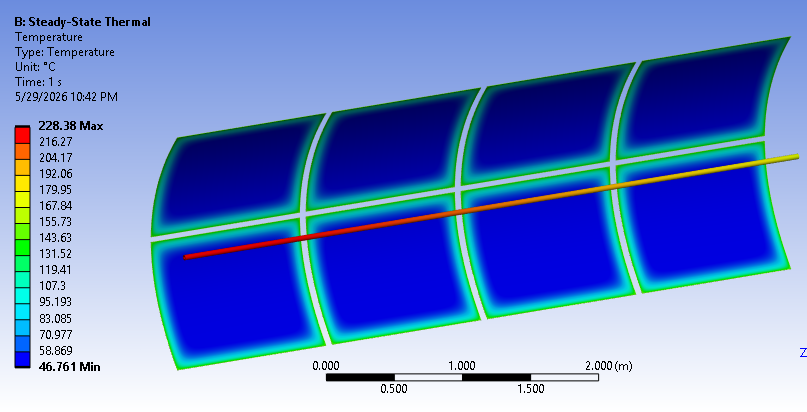
simulation archive; not a validated heat-to-electricity result.
simulation archive; not a validated heat-to-electricity result.
Geothermal and waste heat
Thermal-fluid fields
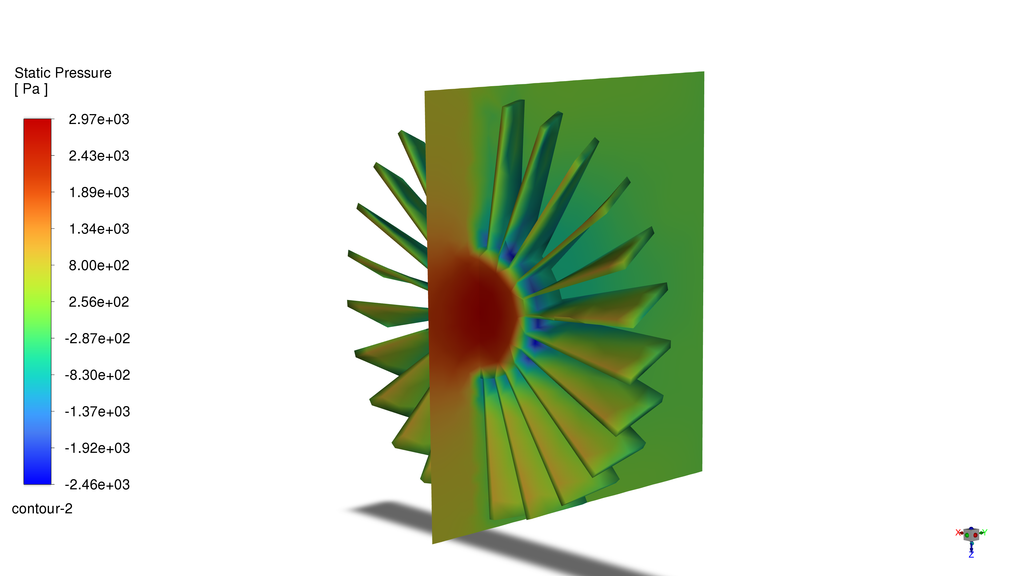
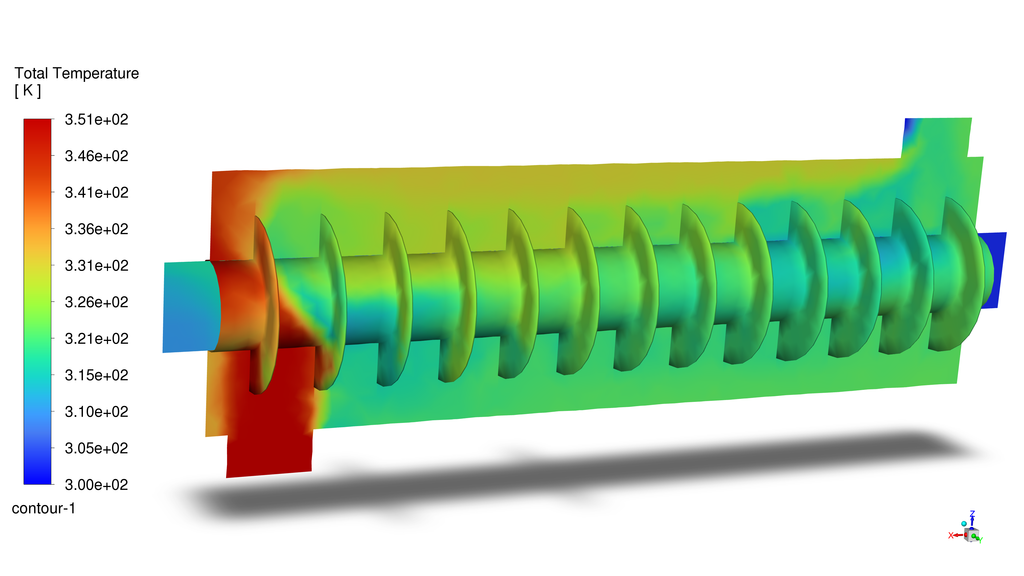
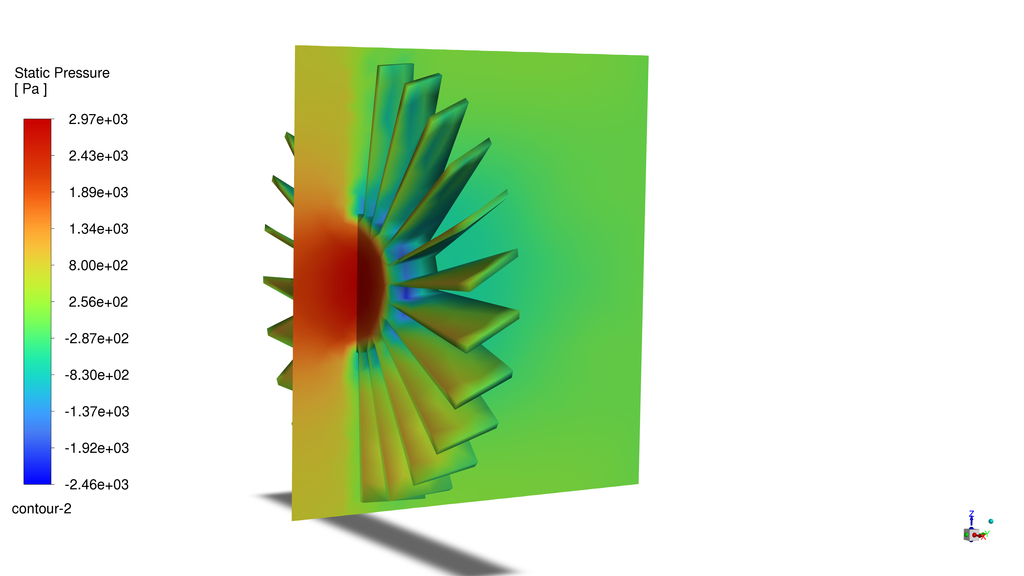
The geothermal and waste-heat-recovery results illustrate archived temperature distributions within simplified heat-exchanger models. Their scenario conditions and color scales differ. The latter review identified unresolved mesh provenance and insufficient verification evidence, so these fields are used for qualitative discussion rather than a quantitative comparison of technology performance.
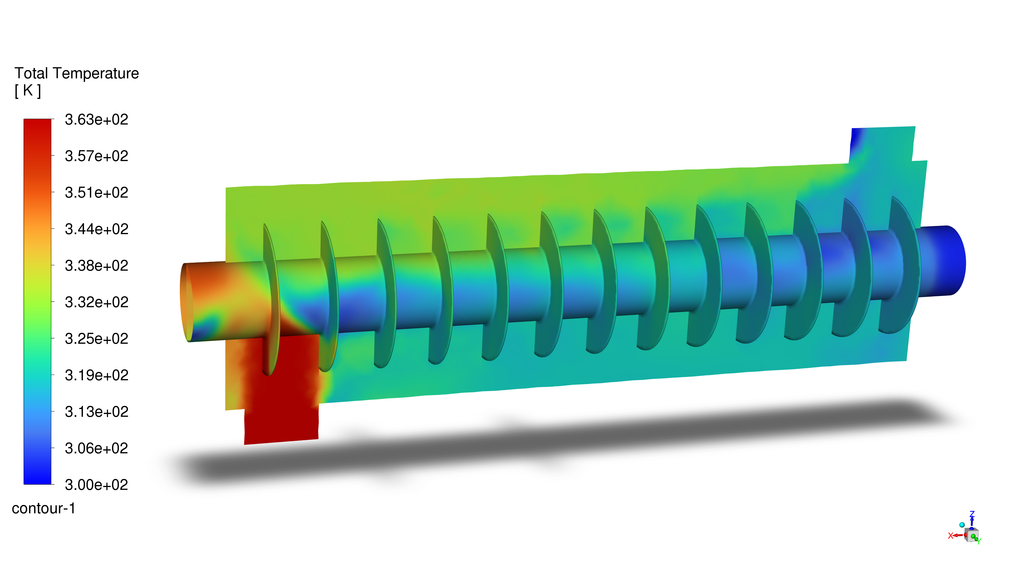
qualitative and has not been supported by a matched grid-refinement study.
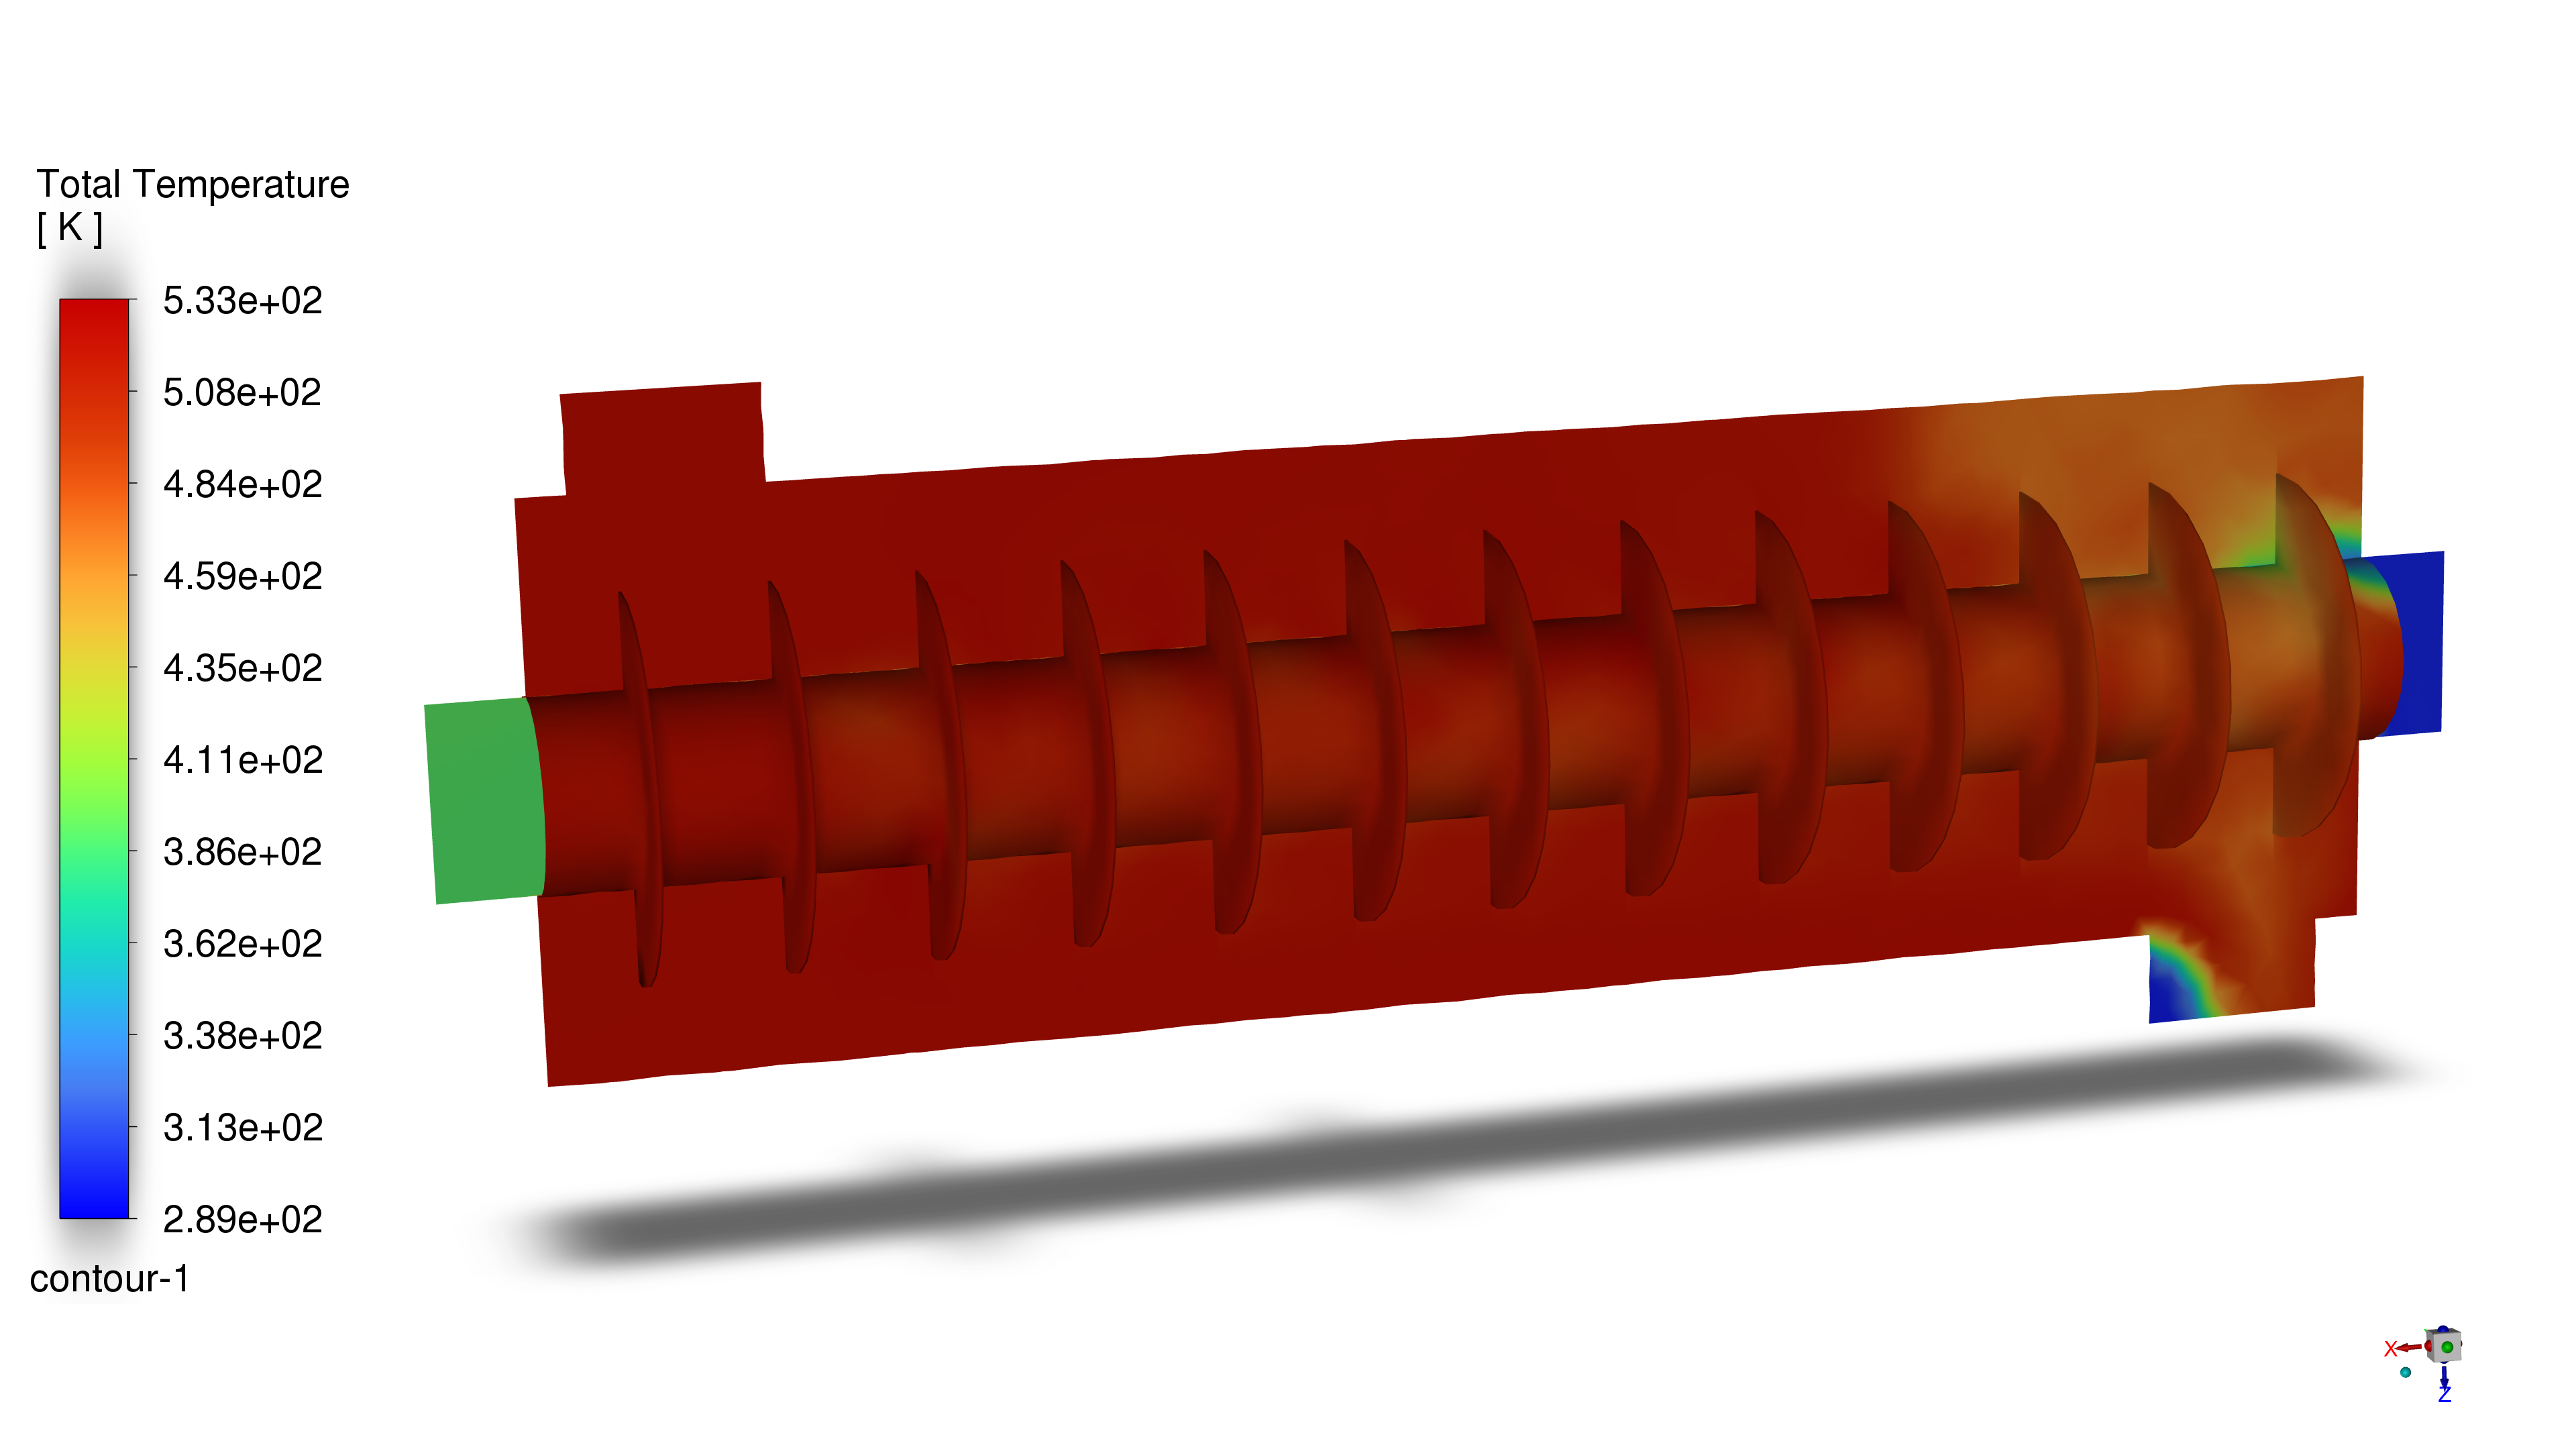
doubled-source-flow case. Retain its identity separately from baseline scenarios.
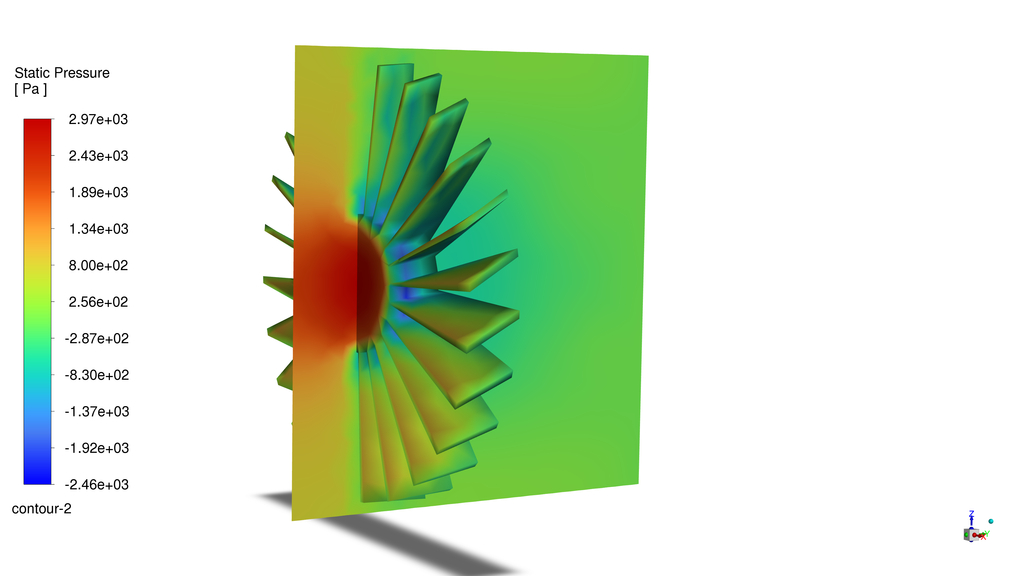
simulation archive; not a validated heat-to-electricity result.
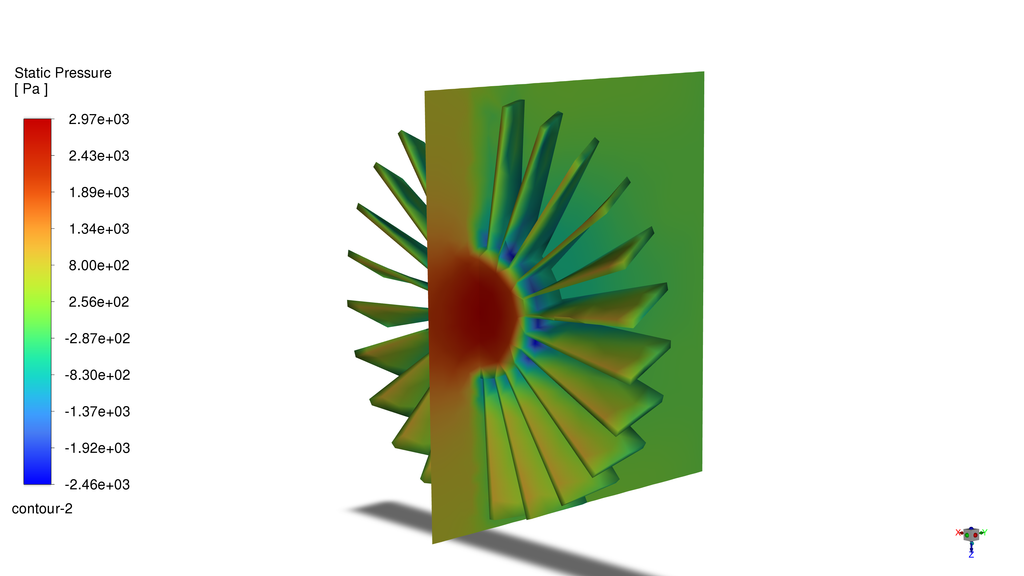
simulation archive; not a validated heat-to-electricity result.
Decision, limits and next steps
Engineering decision
The defensible outcome is a documented modelling and evidence-review workflow. I retain the traceable PV and CSP exports as archived quantities and the thermal-fluid contours as qualitative illustrations. I do not select a superior energy pathway from this dataset: the system boundaries, scales, and component interfaces are not sufficiently resolved for that decision.
Why this matters
A pressure-drop and flow-rate calculation can be reproduced algebraically without establishing recoverable turbine shaft power. Similarly, applying an electrolyzer conversion factor does not validate the upstream energy chain. The study therefore treats downstream hydrogen equivalents as assumption-dependent calculations rather than demonstrated production.
Limitations
The archive does not contain a matched, converged coarse-medium-fine solution series or an external validation dataset for each model. Some saved solver states and exported scenarios do not align, and mesh records require further model-specific checks. These gaps constrain quantitative prediction and cross-technology comparison.
Next research steps
The next steps are to resolve each model’s identity and boundary mapping, rerun controlled cases with systematic mesh checks, reconcile shared mass-flow and thermodynamic states, and compare selected quantities with suitable reference data. A common functional unit and operating basis would then be required before a technology comparison or a downstream sustainability
assessment.
Engineering takeaway
The value of a simulation depends on which decision its evidence can support. Preserving the distinction between an archived output, a reproducible calculation and a validated prediction is part of the engineering result.
Research output and resources
Research development
The work also led to a co-authored manuscript, “Traceable Numerical Screening of PV, CSP, Geothermal and Waste Heat Recovery Pathways for Hydrogen Production,” accepted in Sustainability on 9 October 2026. The website presents the modelling context alongside the limitations identified during the subsequent evidence review.